


- Detailed information
- Performance index
- Reference drawing
- Reference video
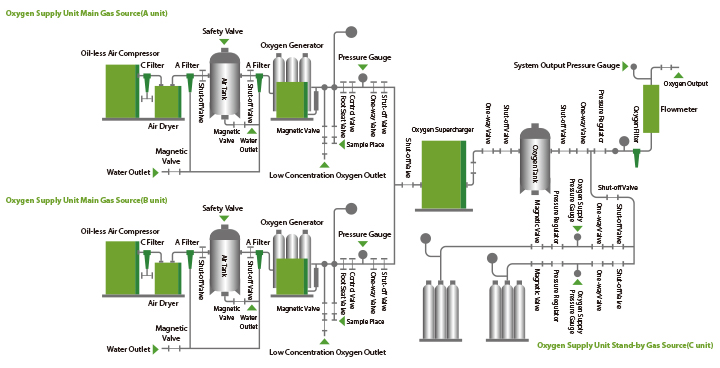
Process Flow Diagram:
| Oxygen Concentration | ≥90% V/V | Water Vapor Content | ≤0.07g/m3 | |||
| Solid Capacity | ≤0.5mg/m3 | Oil Content | ≤0.1mg/m3 | |||
| CO2 Capacity | ≤0.01% V/V | Output Pressure | 0.18MPa~0.4MPa | |||
| CO Capacity | ≤5 ml/m3 | Running Noise | ≤85dB | |||
| Water Content | ≤0.07g/m3 | Power Requirement | AC 380V/50Hz | |||
| Oxygen should be no smell. | ||||||
| Gaseous acid and alkali content should comply with the regulation 5.2.5 of YY/T0298. | ||||||
| Ozone and other gaseous oxides content should comply with regulation 5.2.6 of YY/T0298. | ||||||
| The maximum limit of particulate pollutants. | ||||||
| Particle Size of Pollutants | 0.1μm | 0.2μm | 0.3μm | 0.5μm | 1μm | 5μm |
| Maximum Limit | 100 000 | 23 700 | 10 200 | 3 520 | 832 | 29 |